

Unleashing Potential, Sustaining Growth
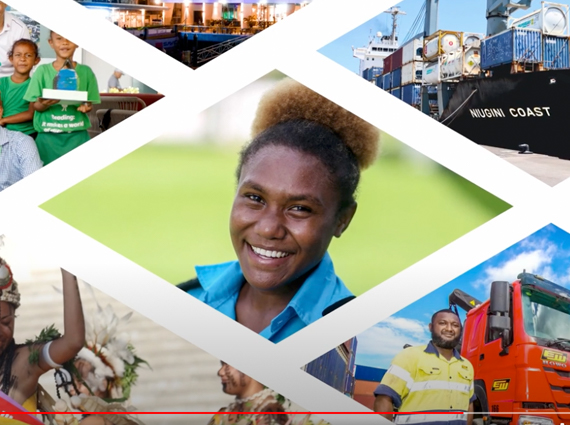
Welcome to Steamships, where possibilities abound and innovation thrives. As a leader in the industry, we embrace the power of diversity, bringing together a range of talents, expertise, and ventures under one dynamic umbrella. With a portfolio that spans across multiple sectors, we navigate through varied landscapes, adapting and excelling in an ever-evolving business environment.


Growing Today, Preserving Tomorrow Our Pledge to Sustainable and Good Practices
How we work
Our commitment to versatility allows us to seize opportunities, explore new markets, and create synergies that drive growth and success. With a firm belief in collaboration, we foster an inclusive culture that celebrates unique perspectives, harnesses collective strengths, and propels us forward. From groundbreaking innovations to transformative ventures, our diversified company is a catalyst for progress, consistently pushing boundaries and making a positive impact in the communities we serve.
Learn More2022 Annual Report
Welcome to Steamships, where positive financial growth is not just a goal but a reality we consistently achieve. With a steadfast focus on strategic planning, prudent decision-making, and a customer-centric approach, our company has experienced remarkable growth in recent years. Through our unwavering commitment to excellence and a keen understanding of market dynamics, we have successfully expanded our operations, diversified our portfolio, and strengthened our position in the industry. This growth is a testament to our dedicated team, who consistently deliver exceptional results and drive our company's success.
View Reports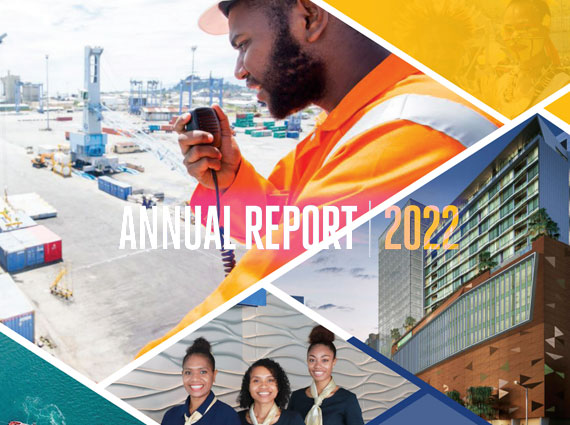
Partners


Press Releases
Welcome to our company press releases, where we keep you informed about the latest developments and exciting happenings within our organisation. From groundbreaking innovations to strategic partnerships, impactful initiatives, and noteworthy achievements, our press releases offer a glimpse into the dynamic world of our company.
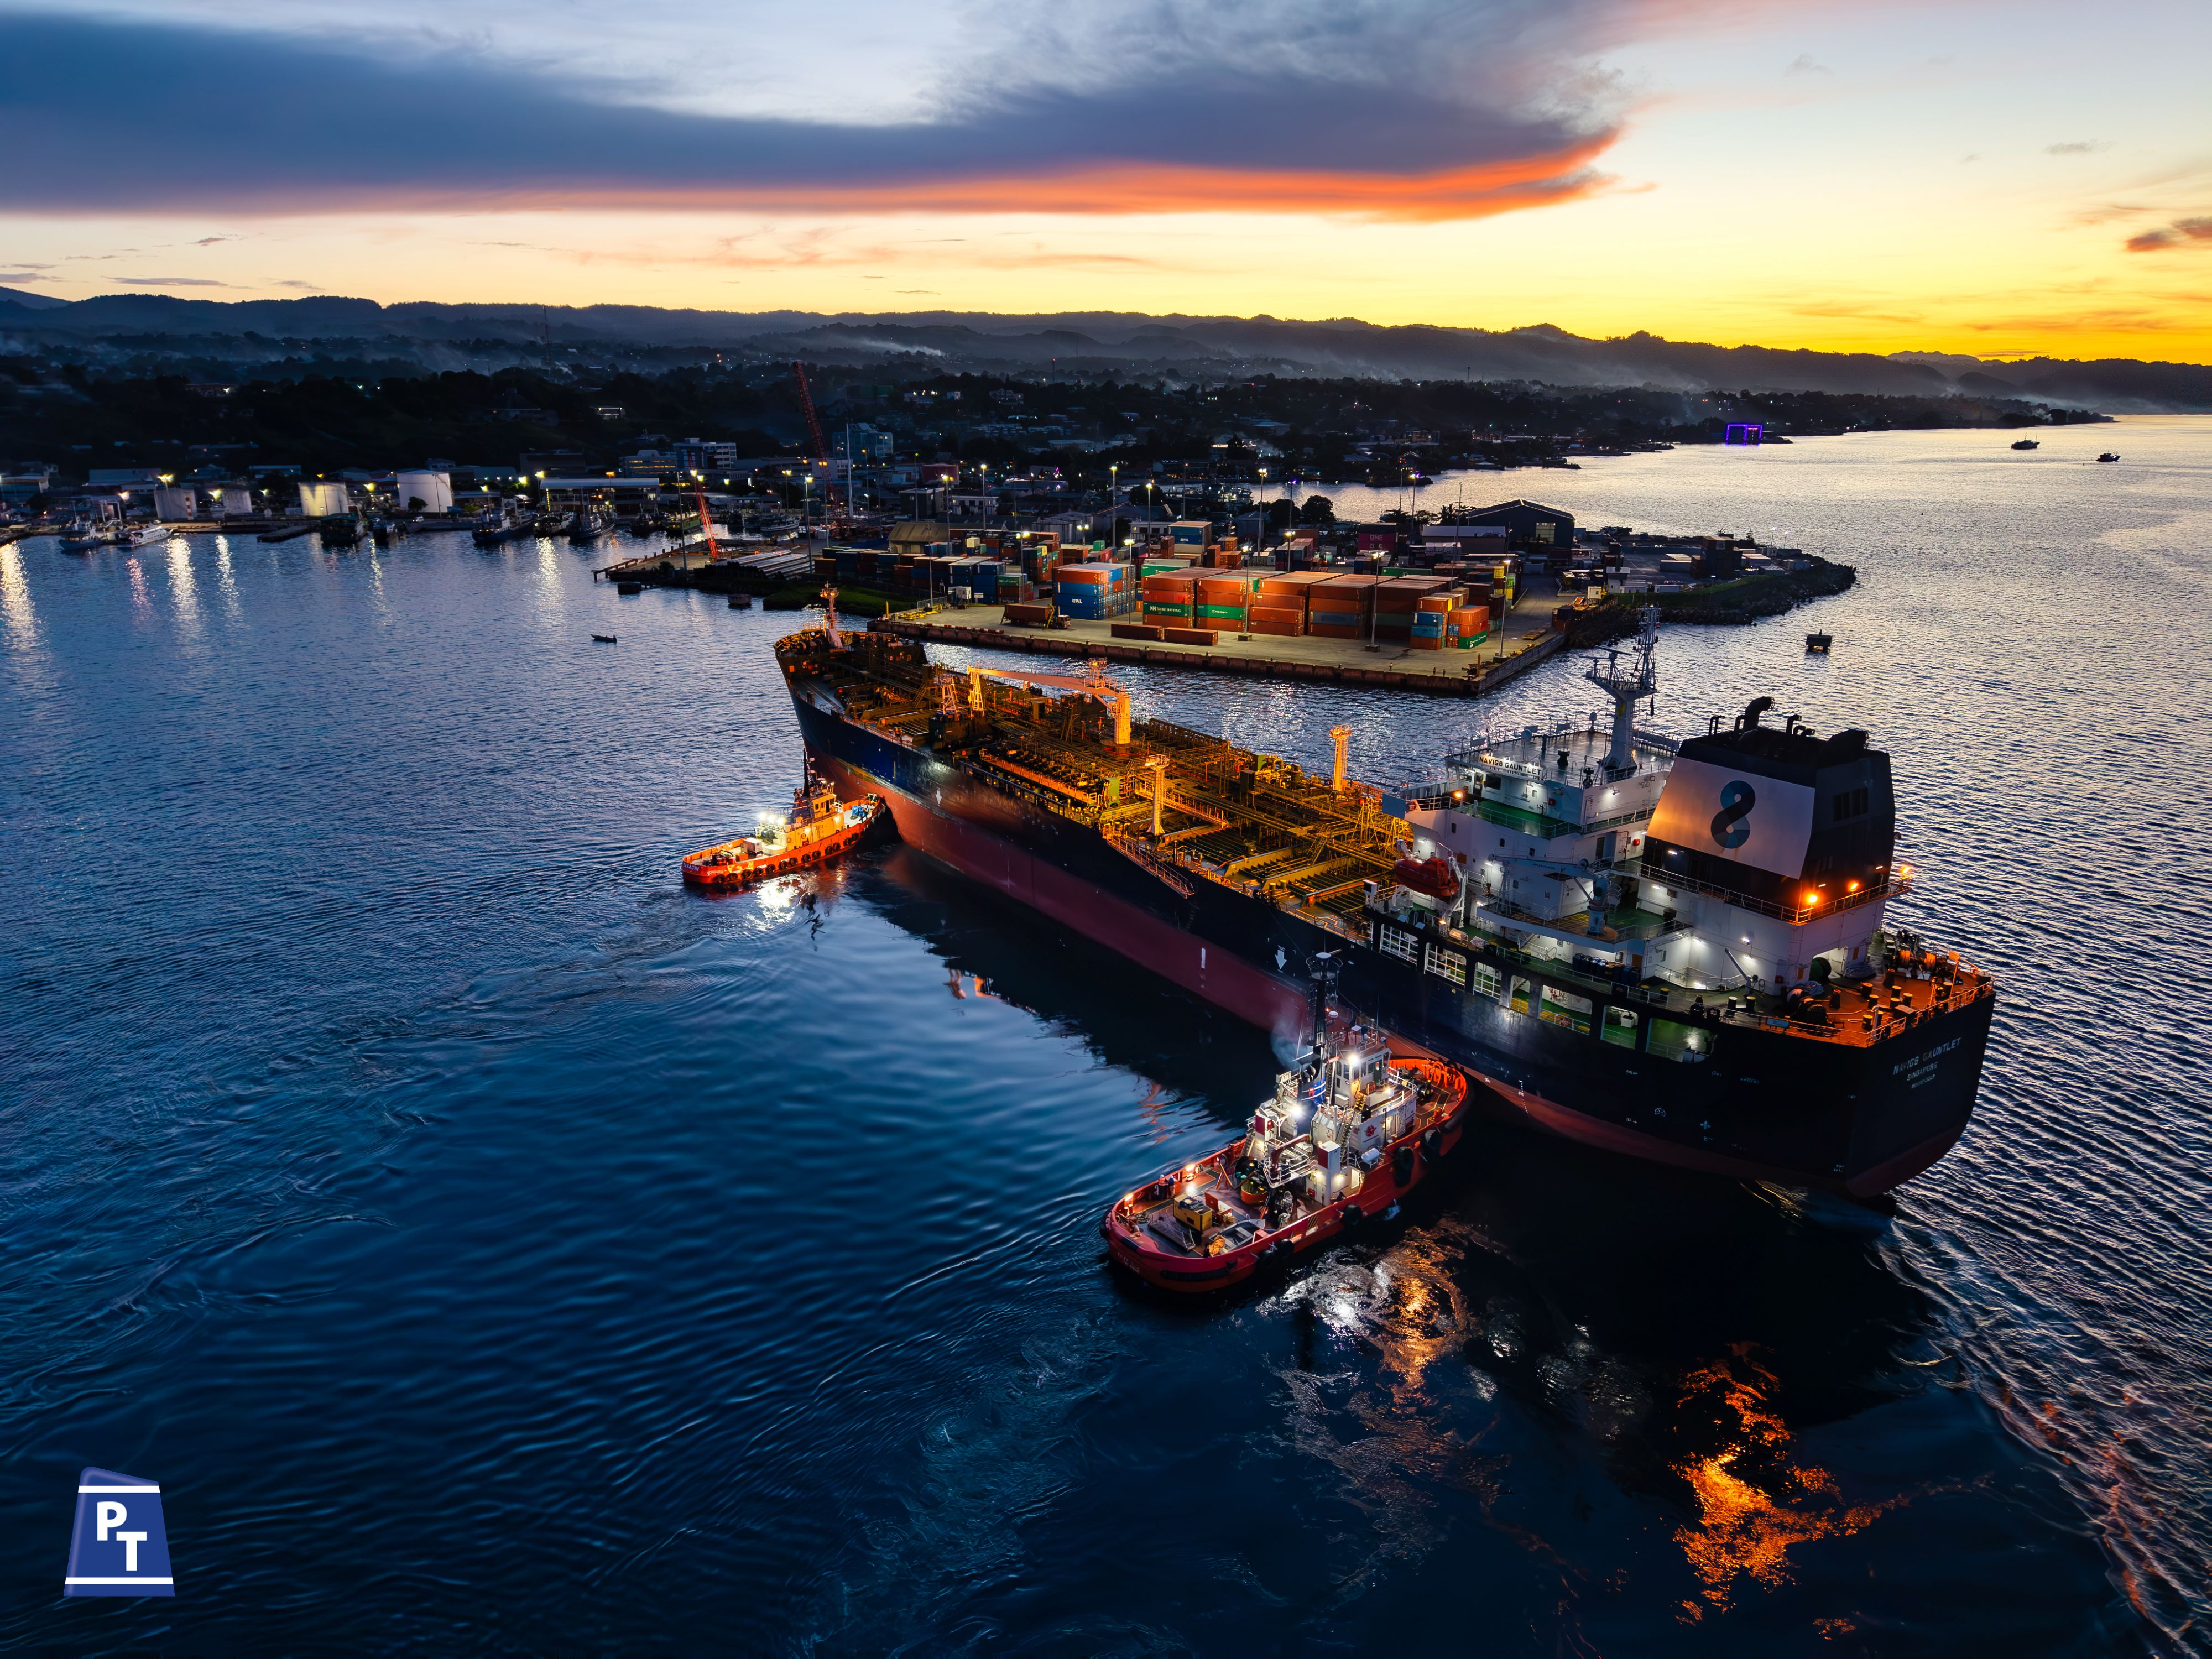
Pacific Towing Strengthens Honiara Port Harbour Towage Capability
Pacific Towing Strengthens Honiara Port Harbour Towage Capability
Steamships appoints Damian Cooper to Lead Hospitality Division
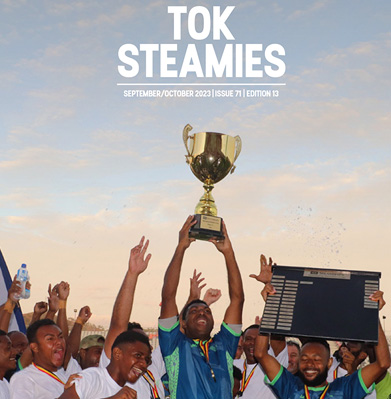
Subscribe your email to our TOK STEAMIES Newsletter